
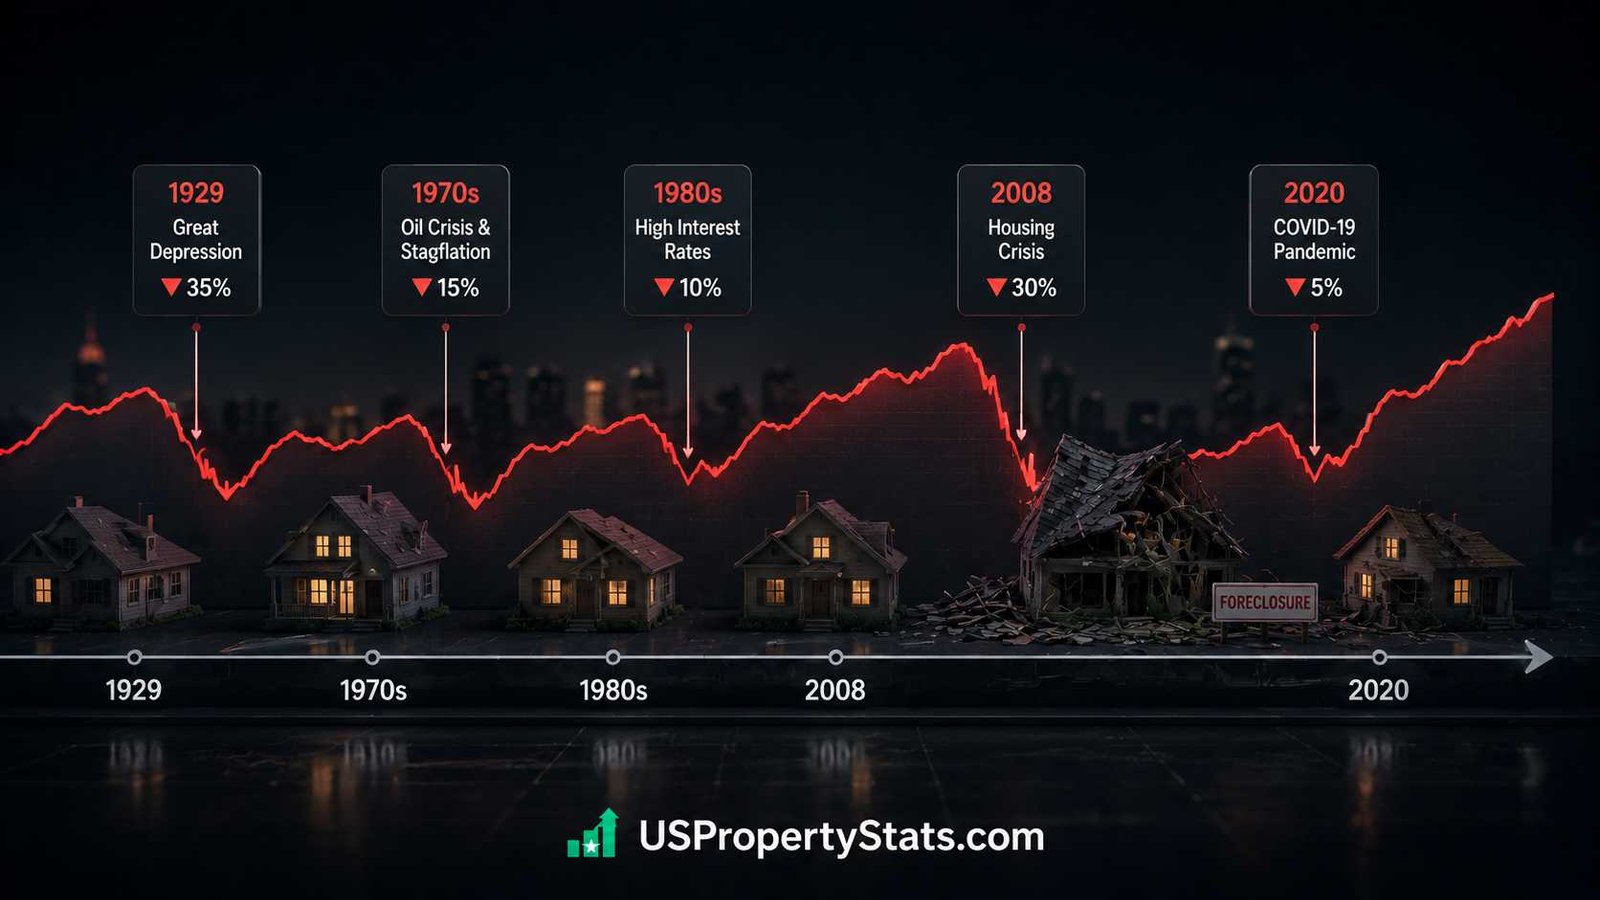
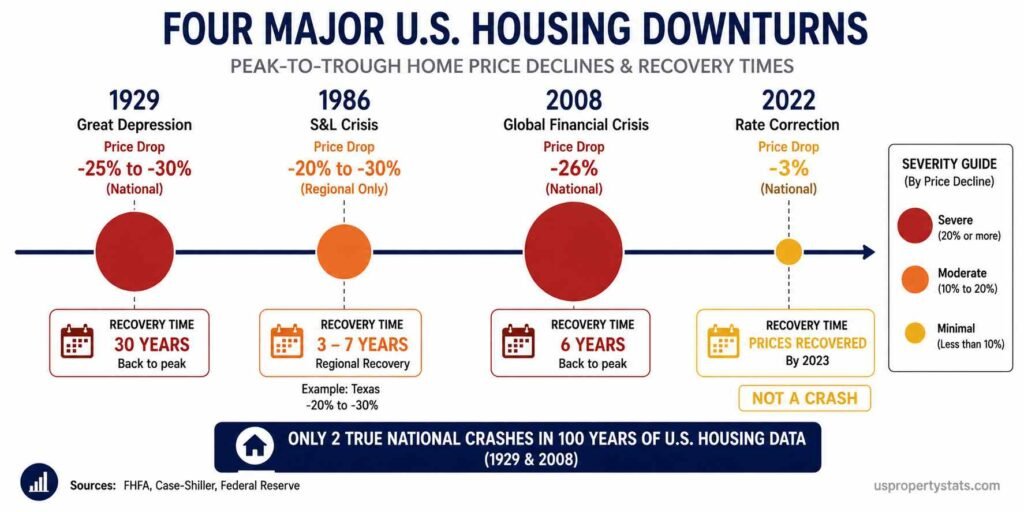
The United States has experienced four significant housing market downturns since 1929: the Great Depression collapse (1929-1939), the regional S&L crisis (1986-1991), the Global Financial Crisis (2006-2012), and the 2022-present rate-shock correction. The most severe, the 2008 crisis, produced a Case-Shiller national price decline of approximately 26% from peak to trough, with individual markets falling 40-50%. The current 2022-present slowdown has not produced a national price decline and does not qualify as a crash by historical standards.
This page documents each major US housing downturn with quantified price data, timeline, causes, and recovery data. Understanding what actually happened in prior crashes is essential context for evaluating whether current market conditions represent a similar risk. All historical price data is sourced from the FHFA House Price Index, the S&P Case-Shiller Index, and NAR historical data.
| Downturn | Peak | Trough | National Price Decline | Recovery Time | Trigger |
|---|---|---|---|---|---|
| Great Depression | 1925-1926 | 1932-1933 | ~25-30% (nominal) | ~30 years (some markets) | Stock market crash, bank failures, 25% unemployment |
| S&L Crisis (regional) | 1986 | 1989-1991 | National: flat; Texas: -20 to -30% | 3-7 years (regional) | Deregulation, overbuilding, oil price collapse |
| Global Financial Crisis | Q1 2006 | Q1 2012 | -26% (Case-Shiller); -12% (FHFA) | 6 years nationally | Subprime collapse, foreclosure cascade, banking crisis |
| 2022 Rate-Shock Correction | June 2022 | Jan 2023 (partial) | -3% nationally; -20-30% in select metros | Ongoing (national prices resumed gains) | Fastest rate increase cycle since 1980 |
The table reveals an important pattern: national housing crashes are rare, severe, and historically driven by credit failures rather than simple price overvaluation. The 2008 crisis is the only true nationwide crash in modern data. The Great Depression predates reliable national price indices. The S&L crisis was regional and never produced national price declines. The 2022 correction has not produced sustained national price declines despite the sharpest rate increase since the early 1980s.
The Great Depression Housing Collapse (1929-1939)
| Data Point | Figure | Source / Notes |
|---|---|---|
| Stock market crash date | October 24-29, 1929 | Dow fell 25% in two days (Black Thursday/Tuesday) |
| Peak unemployment | ~25% | Bureau of Labor Statistics historical records |
| National home value decline | ~25-30% nominal | Federal Reserve historical estimates |
| Manhattan price decline | Over 50% by 1933 | Historical property records, Federal Reserve NY |
| Bank failures (1930-1933) | 9,000+ banks | FDIC historical data |
| Price recovery | Prices did not recover until post-WWII in most markets | Some estimates suggest full recovery not until 1960 |
| Legislative response | National Housing Act 1934 (FHA), creation of 30-year fixed mortgage | HUD historical records |
The Great Depression housing collapse was not primarily a housing market failure; it was a systemic economic collapse that destroyed housing demand by eliminating income, credit, and confidence simultaneously. When the stock market lost nearly 90% of its value between 1929 and 1932, the collateral effect on housing was catastrophic. Unemployment reaching 25% meant roughly one in four working Americans could no longer pay their mortgage. Banks that had financed those mortgages failed by the thousands, eliminating credit for new buyers.
The structure of Depression-era mortgages amplified the crisis. Most pre-Depression mortgages were short-term balloon loans (5-7 years) that required periodic refinancing. When banks failed and credit disappeared, homeowners facing maturity on their balloon loans had no refinancing option, triggering forced defaults even among borrowers who were current on payments. This structural failure directly led to the creation of the modern 30-year fixed-rate mortgage through the National Housing Act of 1934, the FHA, and eventually the creation of Fannie Mae in 1938.
Data on exact Depression-era price declines is imprecise by modern standards. The HAR historical analysis estimates home values fell “roughly 25-30% nationwide, and in some areas much more.” Manhattan lost over half its value by 1933. The recovery was extraordinarily slow: meaningful nationwide price appreciation did not resume until post-WWII, and some historical analyses suggest full recovery of pre-crash price levels in the hardest-hit markets did not occur until the 1950s or 1960s.
The S&L Crisis and Regional Crashes (1986-1991)
| Data Point | Figure | Notes |
|---|---|---|
| S&L institutions that failed | 1,043 of 3,234 | FDIC: 32% of all S&L institutions collapsed |
| Taxpayer bailout cost | ~$132 billion | Resolution Trust Corporation (RTC) final cost |
| Texas price decline (peak to trough) | -20% to -30% in major metros | Dallas, Houston, San Antonio hardest hit |
| National price impact | Flat to -2% | No national price crash; regional only |
| Primary affected markets | Texas, Oklahoma, Louisiana, New England | Oil price collapse + overbuilding in energy states |
| Recovery period | 3-7 years (market-dependent) | Texas recovered faster than New England |
| RTC properties sold | $394 billion in assets | Largest government financial intervention to that date |
The Savings & Loan crisis of the 1980s is the most misunderstood entry in housing crash history because it was fundamentally regional, not national. The FDIC documents that 1,043 of 3,234 S&L institutions failed between 1986 and 1995, requiring a $132 billion taxpayer-funded bailout through the Resolution Trust Corporation. But these failures produced severe housing market damage primarily in oil-dependent states where overbuilding collided with the oil price collapse of 1986.
Texas was the epicenter. Dallas and Houston had experienced a construction boom during the early 1980s oil price surge, with S&L institutions funding speculative commercial and residential development. When oil prices collapsed from $30 per barrel to under $10 in 1986, the Texas economy lost its primary demand driver simultaneously. Housing prices in Dallas and Houston fell 20-30% from peak while national prices remained essentially flat. New England experienced a separate but concurrent regional correction driven by the collapse of the minicomputer industry and overbuilt commercial real estate.
The S&L crisis established an important pattern for understanding housing market risk: severe regional crashes are possible even when national conditions appear stable. A combination of local economic shock (oil prices, tech industry collapse) plus overbuilding plus credit excess in specific institutions can produce devastating local markets without triggering national contagion. This regional containment was possible in the 1980s partly because S&L institutions were geographically limited, unlike the national mortgage securitization networks that transmitted the 2008 crisis globally.
The 2008 Global Financial Crisis (2006-2012)
| Data Point | Figure | Source |
|---|---|---|
| National price peak | Q1 2006 | Case-Shiller national index |
| National price trough | Q1 2012 | Case-Shiller national index |
| Peak-to-trough decline (Case-Shiller) | -26% | S&P Case-Shiller national index |
| Peak-to-trough decline (FHFA HPI) | -12% | FHFA (excludes foreclosures, conforming only) |
| Worst single year (Case-Shiller) | -18.5% (Dec 2007 to Dec 2008) | Largest annual drop in index history |
| Worst hit metro (peak to trough) | Phoenix: -56%; Las Vegas: -62% | Case-Shiller metro indices |
| Annual foreclosure filings peak | 2.87 million (2010) | ATTOM / RealtyTrac |
| Distressed sales share (peak) | ~49% of all transactions (2009) | NAR historical data |
| Peak unemployment | 10.0% (October 2009) | BLS |
| Recovery time (national median price) | ~6 years | NAR: median price recovered to pre-crisis level by ~2013 |
| GDP contraction | -4.3% peak to trough | Bureau of Economic Analysis |
The 2008 Global Financial Crisis is the defining housing market event of the modern era and the baseline against which every subsequent housing market discussion is implicitly measured. The mechanism was a feedback loop between credit creation and asset prices. Mortgage originators issued loans to borrowers who could not repay them (subprime mortgages). Those loans were securitized into complex instruments (CDOs, MBS) that were sold globally. Rating agencies gave these instruments investment-grade ratings. When borrowers began defaulting as teaser rates reset, the securities lost value, the institutions holding them faced insolvency, and credit markets froze globally.
The price data shows two distinct phases. The first phase (2006-2008) was a gradual correction as the subprime market imploded. The second phase (2008-2012) was a forced-selling cascade driven by foreclosures. ATTOM data records 2.87 million foreclosure filings in 2010 at the peak of the crisis. With distressed sales reaching approximately 49% of all transactions in 2009, the market was effectively flooded with forced sellers who had no floor on prices. This is the mechanism that produced 56% declines in Phoenix and 62% declines in Las Vegas: not just fewer buyers, but millions of forced sellers.
The FHFA’s -12% peak-to-trough figure versus Case-Shiller’s -26% reflects a methodological difference worth understanding. FHFA’s HPI uses only conforming conventional mortgages (Fannie/Freddie), which excludes foreclosure sales and jumbo loans. Case-Shiller uses all arm’s-length transactions including foreclosures. The gap between the two measures represents the price discount that forced foreclosure sales introduced into the market. In the current market, with distressed sales at only 2%, these two measures converge much more closely.
Recovery was asymmetric by geography. NAR data shows the national median price recovered its pre-crisis peak by approximately 2013-2014, roughly 6-7 years after the 2006 peak. But markets like Phoenix and Las Vegas, which fell 50-60%, took until 2018-2019 to reach prior price levels. Detroit-area markets have not fully recovered on an inflation-adjusted basis as of 2026.
The 2022 Rate-Shock Correction (2022-Present)
| Data Point | Figure | Source |
|---|---|---|
| National price peak (Case-Shiller) | June 2022 | S&P Case-Shiller |
| National price trough (Case-Shiller) | January 2023 (-3% from peak) | S&P Case-Shiller |
| National prices by April 2026 | +1.7% YoY (FHFA); new record highs in nominal terms | FHFA Q1 2026 |
| 30-year rate change (2021-2023) | 2.65% to 7.79% in 24 months | Freddie Mac PMMS |
| Existing home sales decline | 6.12M (2021) to 4.06M (2024): -33.7% | NAR |
| Worst-hit metro price declines | Austin -6.9% (FHFA Q1 2026); Cape Coral -9.1% (Q4 2025) | FHFA |
| Distressed sales share (2026) | 2% | NAR April 2026 |
| Foreclosure filings (2024) | ~322,000 (vs 2.87M peak in 2010) | ATTOM Data |
| National price decline? | No sustained national decline (nominal) | FHFA HPI: positive each quarter since Q1 2012 |
The Federal Reserve raised the federal funds rate from near-zero to 5.25-5.5% between March 2022 and July 2023, the fastest tightening cycle since the early 1980s. The 30-year mortgage rate rose from 2.65% in January 2021 to 7.79% by October 2023, a 512-basis-point increase in less than three years. This rate shock was large enough by historical standards to have triggered a severe price correction: in 1981, rates above 18% contributed to a significant housing downturn.
Why didn’t 2022-2026 produce a crash? The absence of four conditions that defined the 2008 crisis explains the outcome. First, no forced-selling mechanism: 2026 foreclosure filings of approximately 322,000 are 89% below the 2010 peak of 2.87 million. Homeowners are not being forced to sell. Second, no credit excess to unwind: Urban Institute data shows average credit scores for purchase mortgages in 2021-2022 were the highest on record, the opposite of 2005-2007’s subprime expansion. Third, no overbuilding nationally: the US entered 2022 with an estimated 4-5 million unit shortage, meaning supply could not flood the market. Fourth, the lock-in effect actually supported prices: FHFA research estimates the rate lock-in prevented 1.72 million transactions between 2022 and 2024, constraining supply and preventing forced clearing at lower prices.
The correction was real but localized. Austin, Cape Coral, Denver, Boise, and other pandemic boomtowns that combined overbuilding with speculative demand saw 20-30% declines from their 2022 peaks. These are meaningful corrections for affected homeowners. But they have not spread nationally, and the FHFA national index has maintained positive annual appreciation in every quarter since Q1 2012 without interruption. Current data suggests the 2022-present period is better classified as a regional correction plus a severe sales volume slump, not a crash. For current market data, see US Housing Market Statistics and US Housing Market Predictions.
What Caused Each Crash: Comparing the Triggers
| Factor | Great Depression (1929) | S&L Crisis (1986) | 2008 Crisis | 2022 Correction |
|---|---|---|---|---|
| Credit excess / loose lending | Yes (call loans, speculative) | Yes (S&L deregulation) | Yes (subprime, no-doc loans) | No (tight credit standards) |
| Overbuilding | Yes (1920s boom) | Yes (regional, oil states) | Yes (national) | No (chronic shortage) |
| Forced selling mechanism | Yes (balloon loan maturities, bank failures) | Yes (S&L failures, RTC liquidation) | Yes (foreclosure cascade) | No (foreclosures at historic lows) |
| Speculative demand | Yes | Yes (regional) | Yes (nationwide) | Limited (iBuyers, some Sun Belt) |
| Banking system involvement | Systemic collapse | Sector-specific (S&Ls) | Systemic (MBS, CDOs) | No banking crisis |
| National price decline? | Yes (~25-30%) | No (regional only) | Yes (~26% Case-Shiller) | No (briefly -3%, then recovered) |
The comparison table identifies a consistent pattern across all three genuine crashes: each required a forced-selling mechanism to translate price overvaluation into actual price collapse. Overvalued prices alone do not crash markets; sellers simply do not sell at prices they consider too low. It is only when sellers are forced to transact, through foreclosure, S&L liquidation, balloon loan maturity, or margin calls, that cascading price declines occur.
In 2008, approximately 49% of transactions at the trough were distressed sales by definition occurring below voluntary-market prices. That flood of forced supply at distressed prices pulled comparable values down for all nearby homes, further extending the decline. The current market’s 2% distressed share means this mechanism is absent. HAR’s historical analysis summarizes the structural difference: “Unlike the systemic risks of 2008, many recent slowdowns have been corrections rather than crashes, where prices adjust back towards more sustainable levels after rapid run-ups.”
The absence of crash-triggering conditions in 2026 does not mean the market is risk-free. Regional crashes are always possible, as the S&L crisis demonstrated. Markets with excess new construction, affordability exhaustion, and economic headwinds (Florida, Texas Sun Belt metros) are experiencing price declines today. But the structural prerequisites for a national crash, loose credit generating forced selling at scale, are not present in the 2026 data. For foreclosure-specific data, see Foreclosure Statistics: Filings, Rates, and Trends.
Byline: USPropertyStats Editorial Team | Last Updated: May 2026 | Data sources: FHFA, NAR, S&P Case-Shiller, FDIC, ATTOM, BLS, Federal Reserve